Ramachandran plot
The Ramachandran plot is a fundamental analytical tool used to understand the conformational possibilities of polypeptide backbones based on the rotation of specific bonds. In a polypeptide chain, the main chain bonds subject to rotation are the N-Calpha and Calpha-C bonds, characterized by the torsion angles and respectively.
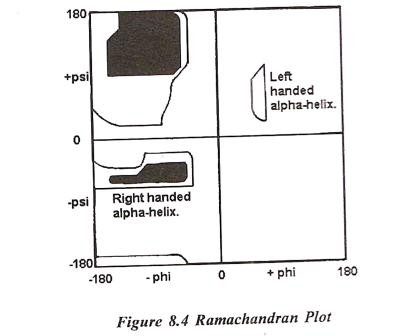
In a polypeptide the main chain N-Calpha and Calpha-C bonds relatively are free to rotate. These rotations are represented by the torsion angles phi and psi, respectively. G N Ramachandran used computer models of small polypeptides to systematically vary phi and psi with the objective of finding stable conformations. For each conformation, the structure was examined for close contacts between atoms. Atoms were treated as hard spheres with dimensions corresponding to their van der Waals radii. Therefore, phi and psi angles which cause spheres to collide correspond to sterically disallowed conformations of the polypeptide backbone. In the diagram above the white areas correspond to conformations where atoms in the polypeptide come closer than the sum of their van der Waals radii. These regions are sterically disallowed for all amino acids except glycine which is unique in that it lacks a side chain. The red regions correspond to conformations where there are no steric clashes, i.e. these are the allowed regions namely the alpha-helical and beta-sheet conformations. The yellow areas show the allowed regions if slightly shorter van der Waals radii are used in the calculation, i.e. the atoms are allowed to come a little closer together. This brings out an additional region which corresponds to the left-handed alpha-helix.
Core Concepts
- Torsion Angles (and): These angles define the rotation around the N-Calpha and Calpha-C bonds, which determine the polypeptide’s backbone conformation.
- Steric Clashes: Atoms are modeled as hard spheres with their sizes approximated by their van der Waals radii. When rotations cause these spheres to overlap (closer than the sum of their radii), the conformations are sterically disallowed.
- Allowed and Disallowed Regions: The Ramachandran plot maps allowed and disallowed conformations based on these steric constraints:
- White regions: Sterically disallowed conformations where atoms overlap.
- Red regions: Allowed conformations without steric clashes, corresponding to common secondary structures like alpha-helices and beta-sheets.
- Yellow regions: Additional allowed areas when slightly smaller van der Waals radii are considered, revealing conformations such as the left-handed alpha-helix.
- Alpha-Helices and Beta-Sheets: These secondary structures occupy well-defined allowed regions on the plot (red areas).
- Left-Handed Alpha-Helix: This region appears only when slightly smaller van der Waals radii are assumed. It is generally not formed by L-amino acids in extended regions but can be adopted by individual residues.
- Glycine’s Unique Role: Glycine lacks a side chain, allowing it to adopt and angles in all four quadrants of the Ramachandran plot. This flexibility enables glycine to frequently appear in turn regions of proteins where steric hindrance would prevent other residues.
- Other Residues in Left-Handed Helices: Occasionally, asparagine and aspartate can stabilize left-handed alpha-helical conformations via side chain-main chain hydrogen bonds, which compensate for steric constraints.
| Region Type | Color on Plot | Stability/Occurrence | Amino Acid Specificity | Notes |
| Sterically Disallowed | White | Not stable, atoms overlap | All amino acids except glycine | Due to steric clashes |
| Allowed (Alpha-Helix, Beta-Sheet) | Red | Stable, common secondary structures | Most L-amino acids | Main regions for protein folding |
| Allowed (Left-Handed Alpha-Helix) | Yellow | Less common, requires smaller radii | Glycine primarily; Asn, Asp occasionally | L-amino acids rarely form extended left-handed helices |